COGS 137 - Practice Midterm (Fa21)
Rules
There will be rules spelled out on the real midterm. Be sure to read them before taking the real exam. There will also be an academic integrity statement for you to complete. Replace the ____________ with your name below on the real deal.
This is the midterm from when the course was offered in fa21. Linear regression was not covered prior to the midterm the last time this course was offered. There will be a question or two on linear regression and the interpretation of linear models on this year’s midterm.
Logistics
Answer the questions in the document called practice-exam-fa21.Rmd. Add your code and narrative in the spaces below each question. Add code chunks as needed. Use as many lines as you need, but keep your narrative concise. Be sure to knit your file to HTML and view the file prior to turning it in.
Packages
You will need the tidyverse package for this (practice) midterm. (For the real deal, you’ll need tidyverse and tidymodels.) If working on datahub, this package has been installed, but you will need to load it. No other packages are required, but if for some reason you want to load in another package, you are permitted to do so.
The data
The dataset you’ll be working with on this practice midterm is all about beach volleyball. The full dataset is explained in detail here and includes match-level data from 76,756 volleyball matches. You should click on that link to see what information is stored in each column in this dataset and what information is included in each column.
Briefly, what you’ll use for this midterm is a subset of the full dataset, including only the 11,699 observations (rows) from 2018 and 2019 but all of the original columns. Each row summarizes the results from a single, distinct match played in a volleyball tournament.
To briefly describe beach volleyball, it is a sport played 2 on 2, so each match involves only 4 players. These data include matches from two different volleyball circuits, the international FIVB and the US-centric AVP. You will not need to know much at all about this sport to complete this midterm, and anything you need to know will be explained.
The data are stored in data/vb_matches.csv. You’ll need to read the dataset in prior to answering any questions on the midterm.
Questions
Question 1 (0.75 points) - How many FIVB and AVP matches are included in this dataset?
Question 2 (0.75 points) - Find the match with the longest duration.
a.  Where was this tournament played (City & Country)?
b.  How long did the match last?
c.  Who were the two winners? </br>
Question 3 (1.5 points) - Across all tournaments included in this dataset, which teams have won the most tournaments? Your response should include both the winning players, their gender, and the number of tournaments they’ve won in descending order. Who has the most wins? How many men’s and how many women’s teams are in the top 10? Note: “winning a tournament” is indicated by winning either a “Gold Medal” (FIVB) or “Finals” (AVP) match, specified in the bracket column.
Question 4 (1.5 points) - Of only the AVP tournaments included in this dataset, how many different cities hosted tournaments in 2018 and 2019? And, which cities (if any) hosted a tournament in both 2018 and 2019? Note that tournaments are named for the city hosting the tournament.
Question 5 (2.5 points) - Prof Ellis plays a lot of women’s beach volleyball and is only 5’5” (65 inches). Despite not having the sheer talent or raw athletic ability to make it as a professional volleyball player, she wonders if she ever had a chance at her height. (Reminder: there are 4 players in each match whose height should be considered.) To help her out, answer each of the following:
a.  Who was the shortest women's player to compete in a tournament in 2018/2019?
b.  How tall are they?
c.  Did they *win* a tournament in 2018 or 2019? </br>
Question 6 (3 points) - Which country has hosted the most FIVB tournaments? Did this differ by year? Generate a visualization that shows how many FIVB tournaments each country hosted. Allow viewer to visualize this by year. And, be sure each tournament is only counted once (regardless of how many games were played).
Question 7 (3 points) - Recreate the plot included below using the data you’ve been working with. Once you have created the visualization, in no more than one paragraph, describe what you think the point of this visualization might be. (Hint: The visualization uses the variable avg_team_height, which is not included in the provided data frame. You will have to create avg_team_height yourself, by determining the average (mean) team height for each winning team.)
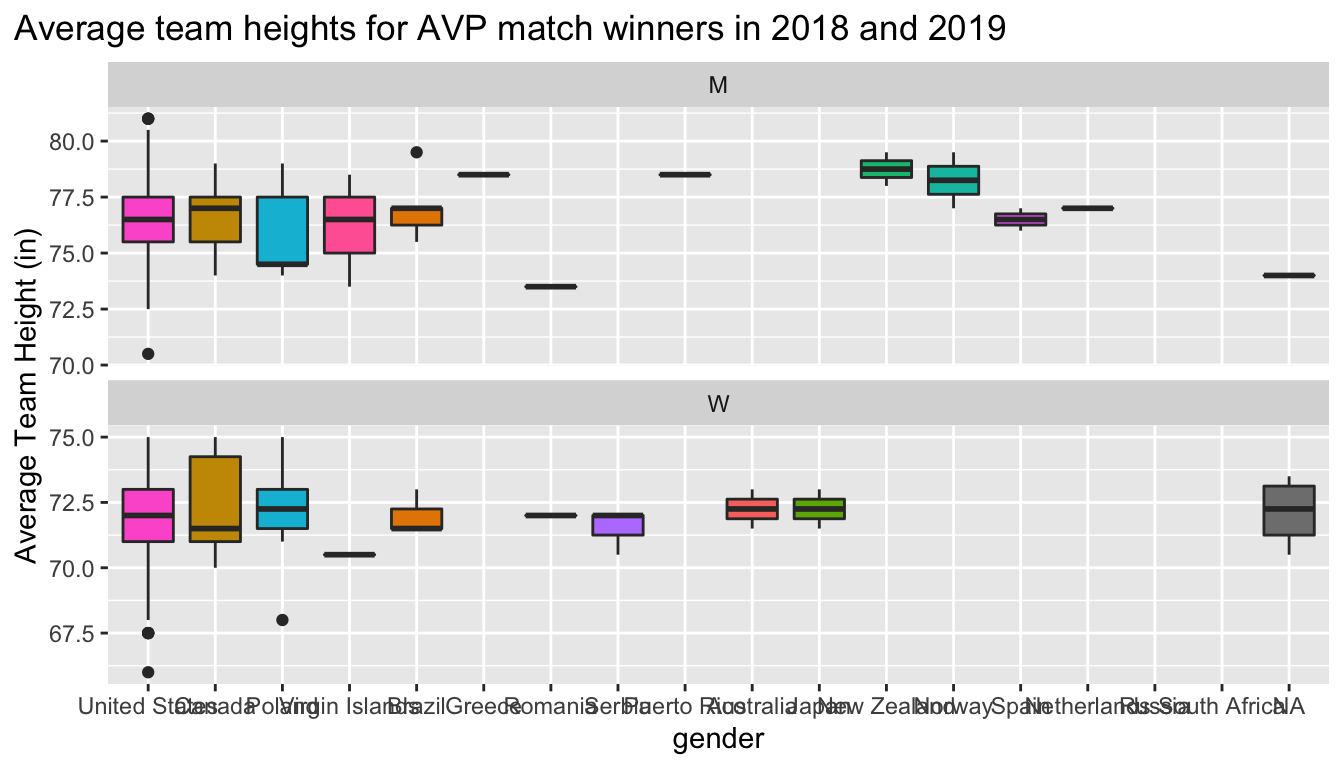
Q7 had a typo when this course was offered previously leading to students spending wayyyyy longer than intended on this exam. That typo has been fixed for this practice midterm.
Question 8 (1 pts) - If you were in charge of designing the plot you just recreated in the plot above, what changes would you make to improve its effectiveness as a visualization? (You do not have to write any code for this question, just explain the different design/viz choices you would make.)