COGS 137 - Practice Midterm (Wi23)
Rules
There will be rules spelled out on the real midterm. Be sure to read them before taking the exam. There will also be an academic integrity statement for you to complete. Replace the `____________` with your name on the real deal.
This is the midterm from when the course was offered in wi23.
Logistics
Answer the questions in the document called practice-exam-wi23.Rmd. Add your code and narrative in the spaces below each question. Add code chunks as needed. Use as many lines as you need, but keep your narrative concise. Be sure to knit your file to HTML and view the file prior to turning it in.
Packages
You will need the tidyverse and tidymodels packages for this midterm. If working on datahub, these packages have been installed, but you will need to load them. You are allowed, but not required, to use additional packages.
The data
The data we’ll be using come from The Axios and Harris Poll and have been provided by the TidyTuesday team.
The data are stored in two different files in the data/ folder: poll.csv and reputation.csv. You’ll want to read each table in and understand what each variable represents prior to completing the exam.
Each variable and the data overall are described in detail here. You should click on that link to see what information is stored in each column in the datasets. But briefly, these two files include data about the 100 “most visible” brands in America. Specifically, reputation.csv includes information from the 2022 poll about these 100 stores across different reputation categories. poll.csv includes information about the same 100 stores but includes information about their rankings across multiple years.
Questions
Question 1 (0.5 points)
How many different industries (industry variable) are represented in these data?
Question 2 (0.5 points)
- Which company had the lowest overall ranking in 2022?
- And for which category (from the
namevariable) did this organization score lowest?
Question 3 (1 point)
Which company in the reputation.csv dataset has the “best” average (mean) rank across all seven categories?
Question 4 (1 point)
Which company had the biggest increase in rank from 2021 to 2022?
Question 5 (1.5 points)
For the industry with only a single “most visible” company in the dataset, has their RQ score been increasing or decreasing overall since 2017?
Question 6 (2 points)
How many companies from each industry category are represented in the 2022 ‘100 Most Visible’ companies in America data? Generate a visualization to display the answer to this question. Be sure to follow best visualization practices discussed in class.
Question 7 (2 points)
Of industries that have at least 5 companies in the dataset, which industry has the highest median 2022 rank? Generate a visualization that allows you to answer this question. Be sure to follow best practices.
Question 8 (2 points)
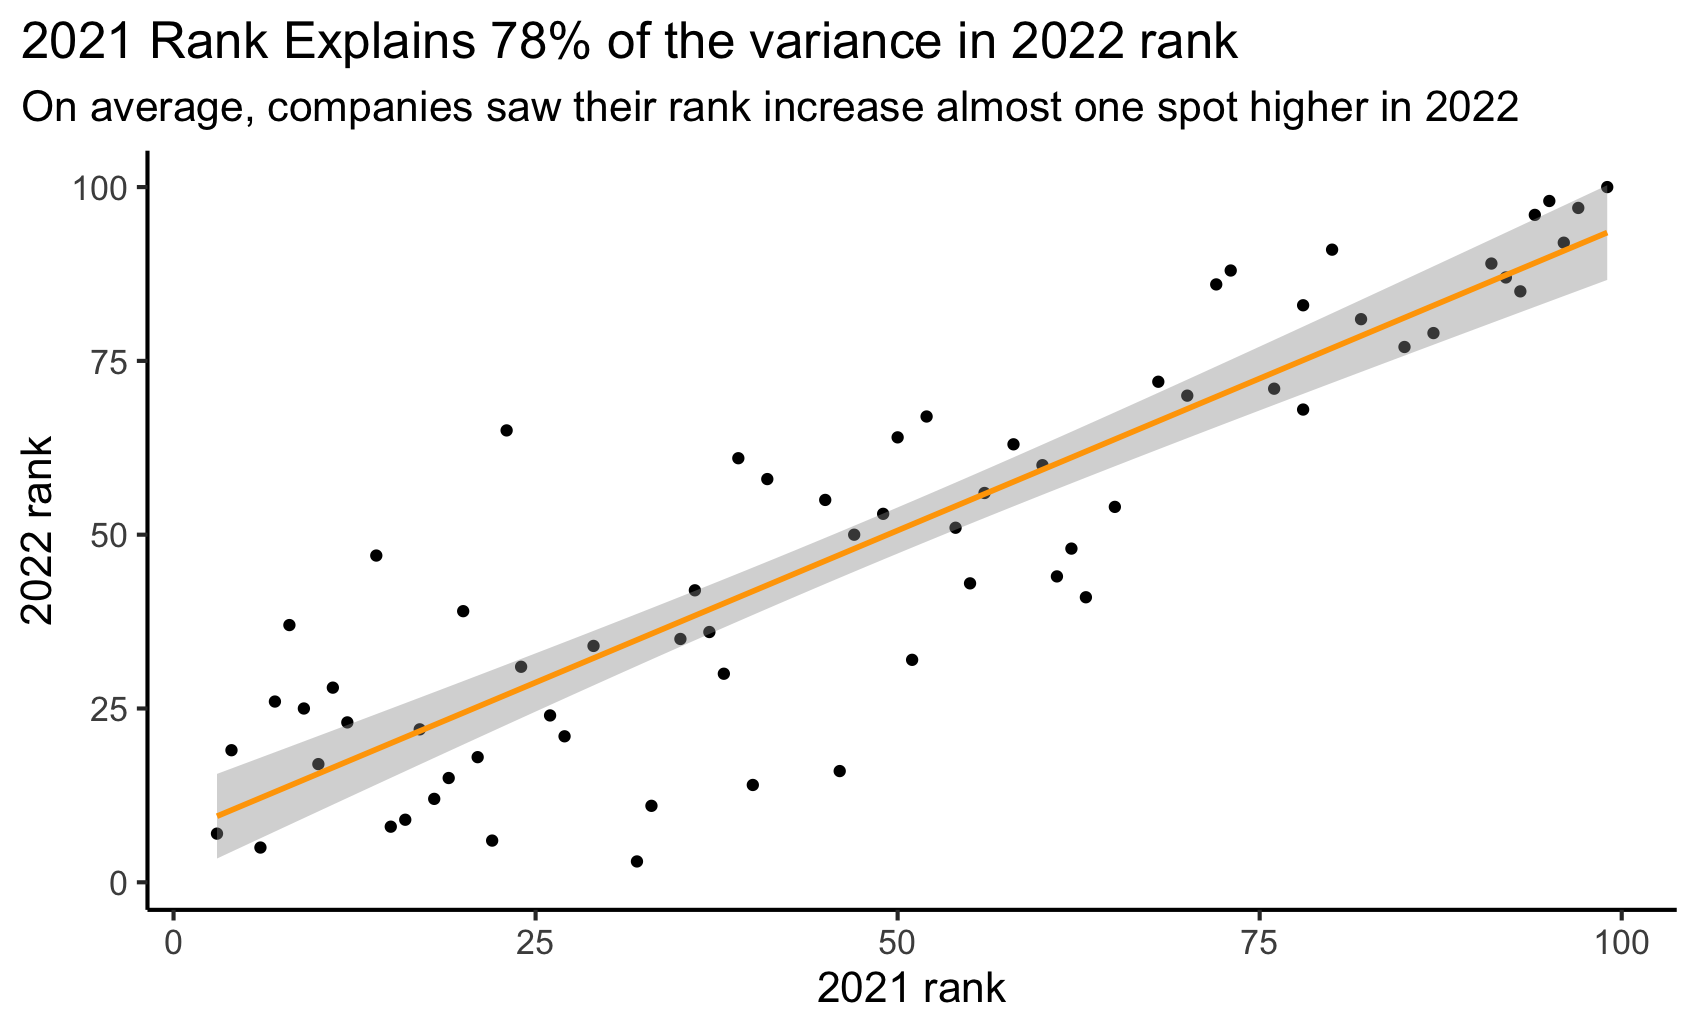
Your boss is curious about how much rankings change from one year to the next. To answer this question, they ask you to determine how well 2021 rankings explain the following year’s 2022 rankings. Generate a linear model to answer this question. Be sure to include your interpretation of the model (in other words your answer to the question “how well do 2021 rankings explain 2022’s rankings?”)
Question 9 (2.5 points)
Recreate the plot included below using the data you’ve been working with. Once you have created the visualization, in no more than one paragraph, describe what you think the point of this visualization might be.
Submit
You’ll always want to knit your RMarkdown document to HTML and review that HTML document to ensure it includes all the information you want and looks as you intended, as we grade from the knit HTML.
Yay, you’re done! To finish up and submit, first knit your file to HTML. Be sure to select both your .Rmd and .html documents when choosing what to commit! Then, commit all remaining changes and push. Before you wrap up the assignment, make sure all documents are updated on your GitHub repo.